
A Daily Analytics Briefing for Editorial Teams
The problem
Editorial teams at independent publishers need to know how yesterday’s stories performed and how the business is trending, but they don’t have time to log into several different dashboards to piece it together. The information existed somewhere; nobody was looking at all of it, because nobody had time to.
The framing
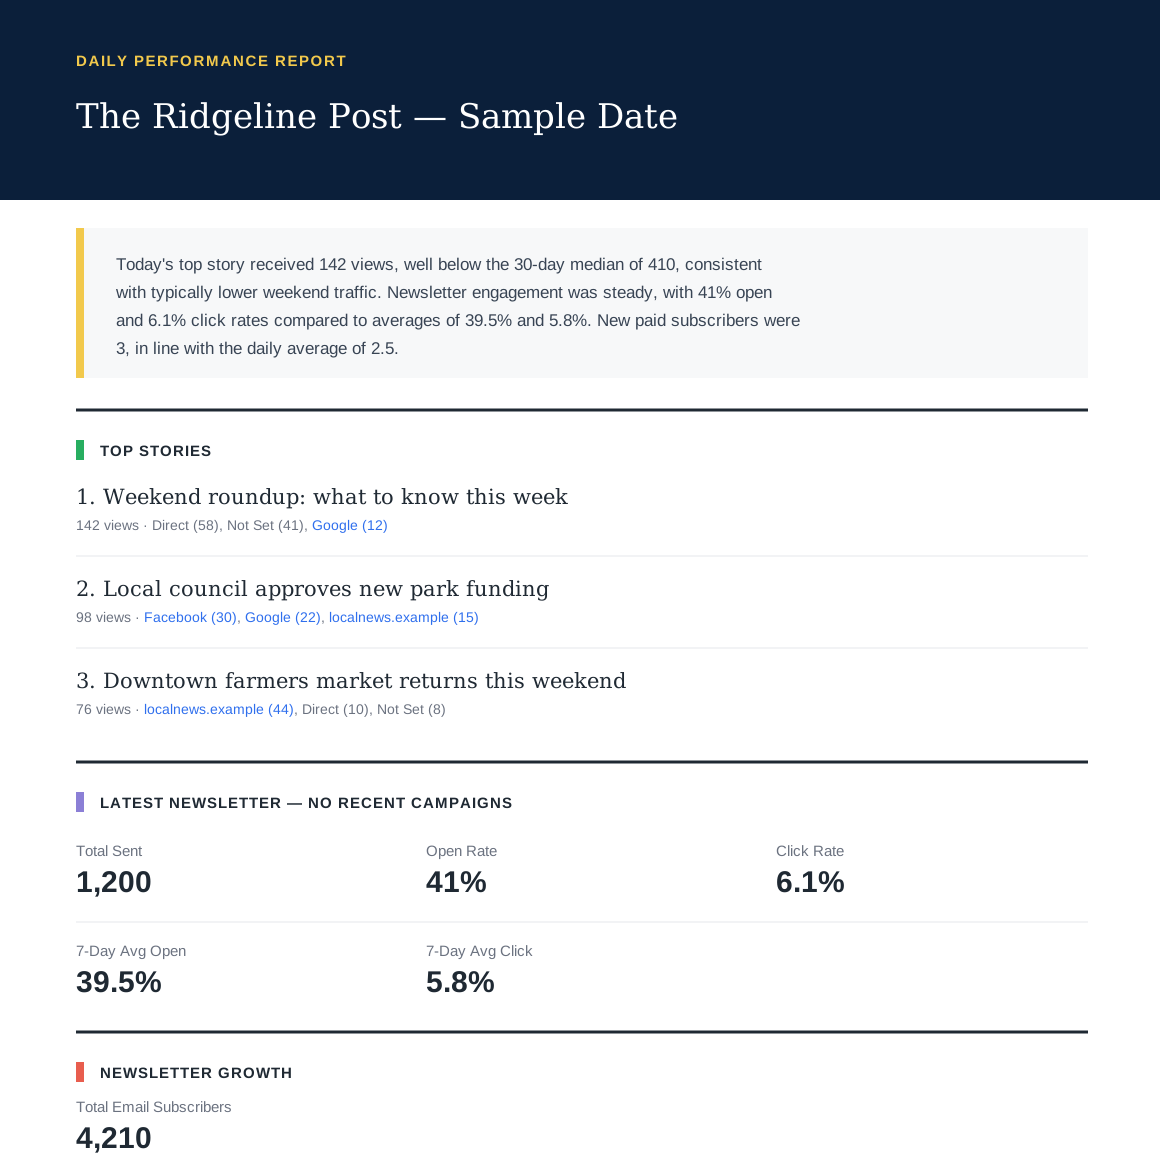
A scheduled pipeline pulls the relevant numbers together every morning: story traffic, subscriber activity, and newsletter performance. Rather than dropping raw numbers into an email, it uses AI to generate a short plain-language summary highlighting what actually matters that day, ahead of the full metrics breakdown.
Tools
Google Cloud Functions, scheduled via GCP’s built-in scheduler. GA4, Pelcro, and Cakemail as data sources. Gemini API for narrative summarization.
Result
A daily email, delivered automatically to editorial and leadership stakeholders, covering: top story performance against a 30-day baseline, newsletter open/click rates against trend, and subscriber growth (email and paid) with day-over-day and 7-day averages. No login, no dashboard, no manual pull required.
What this demonstrates
Turning data into something people actually use is a different skill from building the pipeline itself. This project required both: the integration work to unify three data sources on a schedule, and the judgment to know that a narrative summary, not a wall of numbers, is what gets read by a non-technical audience on a Monday morning.