
Making Sense of Multi-Publisher Data
The problem
Collaborative journalism projects are increasingly pulling data from multiple independent organizations into a shared pool: subscriber counts, audience numbers, coverage areas, sometimes public reference data like Census demographics. Every publisher’s data shows up in a different shape. Field names differ, formats differ, and knowing whether two records refer to the same real publication isn’t always obvious.
This project is a working, end-to-end version of that problem. Five newsroom sources, each structured differently on purpose, resolved into one clean directory and joined to public Census data.
The data is synthetic. The judgment calls behind resolving it are the same ones that come up combining real multi-publisher data, based on work I’ve done building Indiegraf’s own data platform.
The architecture
The pipeline moves data through three stages:
- Raw: every source lands exactly as it arrived, untouched. Nothing gets cleaned up before it’s stored.
- Cleaned: each source gets resolved on its own terms. Dates get parsed into a consistent format, geography gets matched to a real place wherever that’s possible, and each publication gets identified correctly, using a real ID from the source data when one exists, and more careful matching only where it doesn’t.
- Combined: all five sources come together into one directory, joined to public Census data, and surfaced in a simple dashboard.
Keeping raw data untouched matters more than it sounds like it should. It means nothing gets lost or misinterpreted before anyone’s had a chance to actually look at it, and it means going back to fix a mistake later doesn’t require starting over.
Four of the five sources track something like a small local network: one company, several related publications, each with a stable ID already built into the source data. Identifying those correctly was straightforward, the ID already answers the question. The fifth source is the deliberate contrast: four completely unrelated independent publishers who happened to submit their data the same way, with nothing connecting them to each other at all. Treating them as one group would have misrepresented them, so they’re kept distinctly separate all the way through.
One source, a small local media company, arrived with no reliable ID at all, and its newsletters were crammed together as free text in a single field rather than laid out clearly. That’s the one case in this project where matching had to rely on the data itself rather than a clean identifier, closer to what happens with a genuinely small, under- resourced newsroom that doesn’t have the systems in place to export its own data cleanly.
Tools
- Storage: Google Cloud Storage, for holding raw data as it arrives
- Warehouse and transformation: BigQuery and dbt, for cleaning and combining the data
- Dashboard: Streamlit, for a simple, filterable view of the result
- Reference data: US Census Bureau data, pulled directly from their public API
 Dashboard: datalake.caitlinhavlak.com
What I’d change at scale
This version was built to prove the approach, not to handle real publisher volume. A few things would need to change if this were running for dozens of publishers instead of five:
- Matching would need to get smarter. A stable ID solves identity cleanly when one exists, but not every small newsroom’s export will include one. At real volume, this needs a tool like Splink, an open-source matching library that can recognize likely matches on its own, rather than relying on a person to notice every new way a name or record might not quite line up.
- Publishers wouldn’t upload data manually. Right now, files get added to storage by hand. In a real version, a publisher would submit data through a simple form, and a small piece of automation (a Google Cloud Function, triggered the moment a file is submitted) would take it from there. No one would manually manage folders or kick anything off by hand.
- Processing would only touch what’s new. This version already avoids reprocessing data that hasn’t changed, using a feature built into dbt (the tool that cleans and combines the data). That matters more as volume grows: reprocessing everything every time gets slow and expensive fast.
None of this changes the underlying approach. It’s the same raw, cleaned, combined structure, just with more automation and a smarter matching tool doing work a person can’t reasonably keep up with by hand.
Why it mattered strategically
Independent newsrooms are, on their own, small. Most can’t afford a data team, and most don’t have enough scale by themselves to see patterns that only show up across a whole network: which markets are underserved, which publishers are positioned for growth, where a funder’s money would have the most impact. Pooling data changes that. A collaborative that can see itself as a network, not just a list of individual outlets, can make the case for shared resources, coordinated funding, and support that no single small newsroom could justify asking for alone.
That kind of pooling only works if publishers can trust the process. No independent newsroom wants to hand over its data and get back a black box. Being able to show exactly how something got matched, and being honest about the one case where a clean match isn’t possible without more structure than the source data provides, is what makes that trust possible. A collaborative that’s transparent about its own limits is easier to trust than one that quietly guesses and presents every answer with the same confidence.
This same challenge, and the same answer, shows up well beyond newsrooms. Hospitals combining patient data across institutions for research face an almost identical problem: every hospital runs its own system, and no one can be asked to standardize their records before contributing them. The answer is the same one used here: bring the data together first, resolve it centrally, and be transparent about what didn’t resolve cleanly. Global health organizations tracking disease data across dozens of countries use the same approach for the same reason: participation has to come before perfect standardization, or the collaboration never gets off the ground.
The lesson from those examples applies directly to a newsroom collaborative. The organizations that succeed at pooling data aren’t the ones with the cleanest individual systems. They’re the ones with a process that can absorb everyone’s mess without asking any one participant to fix it themselves first.
The dashboard
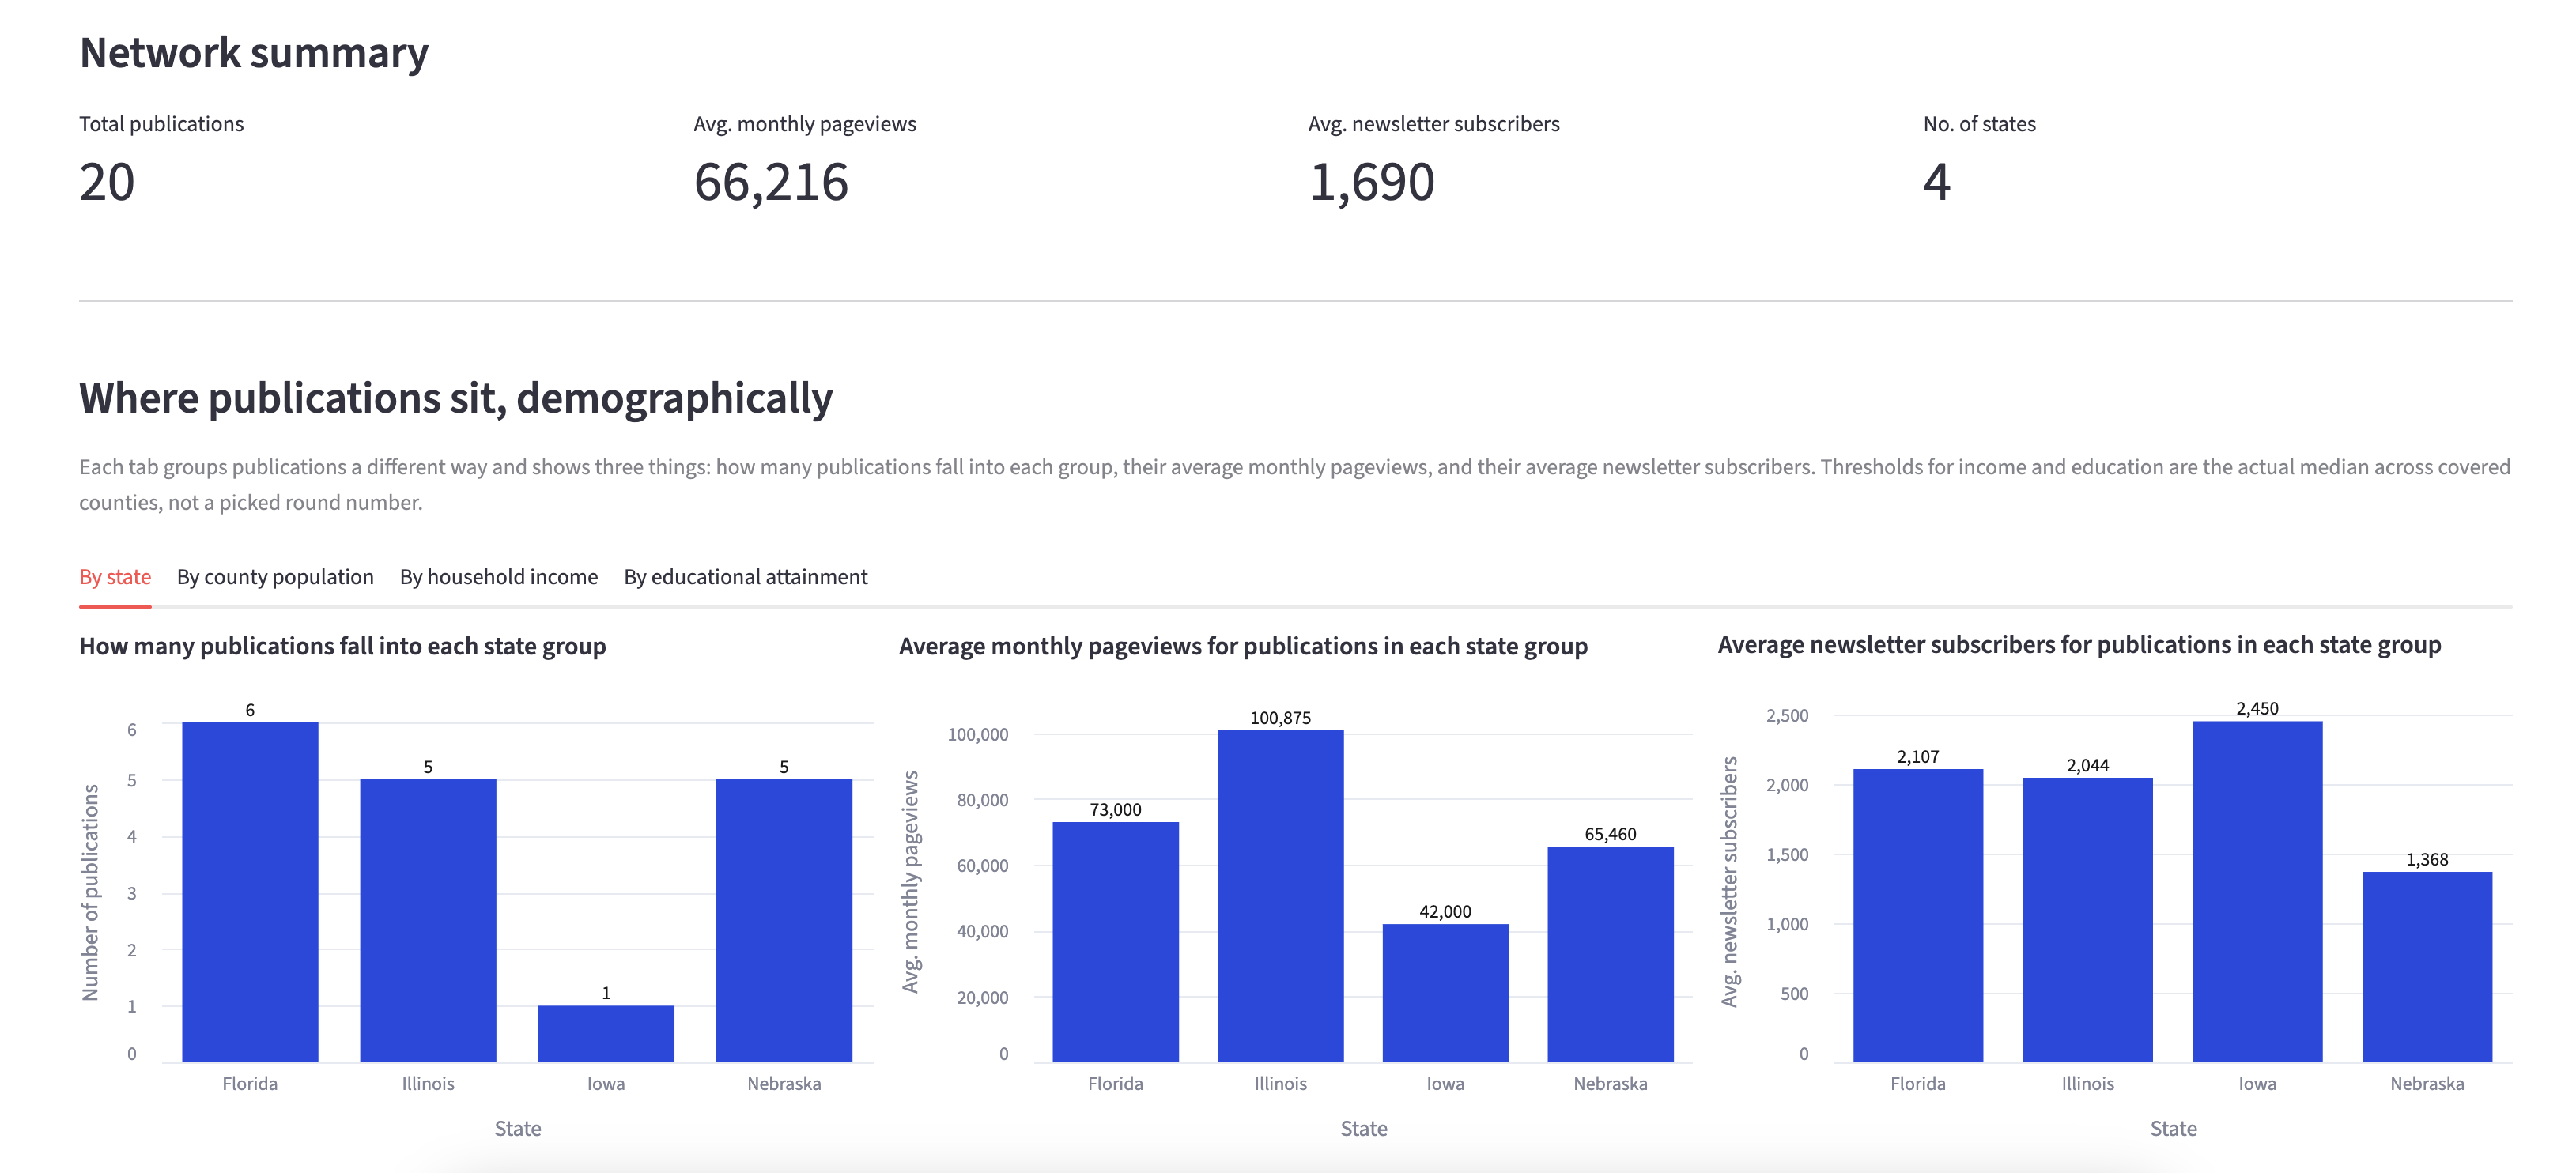
The result is a simple, filterable dashboard showing every publication across all five sources in one place, alongside the Census context for where they operate: county population, household income, and educational attainment, each showing how audience size and newsletter reach compare across those groups.