
Getting Data into the Hands That Need It
The problem
The centralized data warehouse gave Indiegraf a single source of truth for publisher performance, but the customer success team doesn’t live in a data warehouse, and raw numbers aren’t decisions. A revenue figure or a traffic count means little on its own; what the team actually needs to know is whether an account is trending up, holding steady, or sliding, and whether that needs attention this week.
The framing
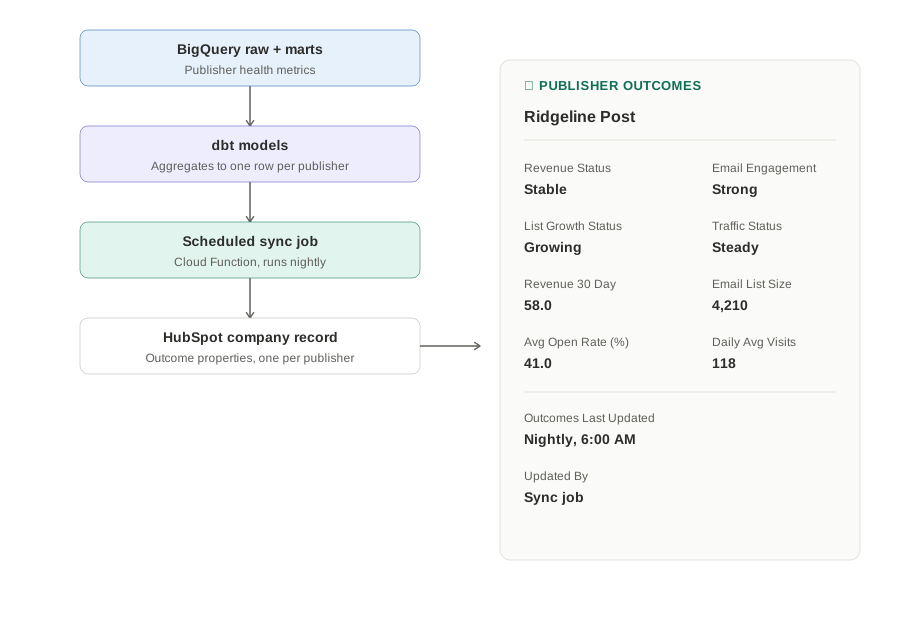
A scheduled weekly pipeline pulls current and prior-week snapshots for every publisher from the warehouse. Rather than writing raw metrics straight into the CRM, it calculates trend status for revenue, traffic, and email list growth by comparing week-over-week change against a threshold, classifying each as Growing, Stable, or Declining. Email engagement gets its own threshold-based status, Strong or Weak, based on open rate. Those status fields, along with the underlying numbers, get written directly onto each publisher’s record.
Tools
Google Cloud Functions on a weekly schedule, BigQuery as the source (reading from a dedicated outcomes mart built on top of the warehouse), the CRM’s API for the write-back.
Result
Customer success staff see a publisher’s trajectory, not just a snapshot, directly on the account record they already work from. A declining account surfaces as “Declining,” not as a number someone has to compare against last week’s number themselves. That’s the difference between exposing data and delivering a signal someone can act on.
What this demonstrates
Data strategy isn’t finished once the warehouse exists, and it isn’t finished once numbers reach a CRM either. The judgment is in deciding what raw metrics actually mean, building that interpretation into the pipeline itself, and delivering a conclusion, not just data, to the team that has to act on it.
This builds directly on the warehouse architecture described in Bringing Publisher Data Into One Place — the piece that follows once the infrastructure exists.